
Every analytics question eventually becomes a benchmark question: is 2% good? Is 40% normal? Without a reference point, people either panic over healthy numbers or celebrate weak ones. This page collects the 2026 baselines for short-link performance — click-through rates, device mix, timing, and usage — so you have something honest to compare against.
Two things to keep in mind as you read. First, the average hides enormous variance: a link in a newsletter footer and a link in a TikTok bio live in different worlds. Second, these baselines are a composite — our own aggregated platform data plus published industry research — and the methodology notes at the end explain exactly how each number was formed.
Baseline 1: Click-through rate by link format
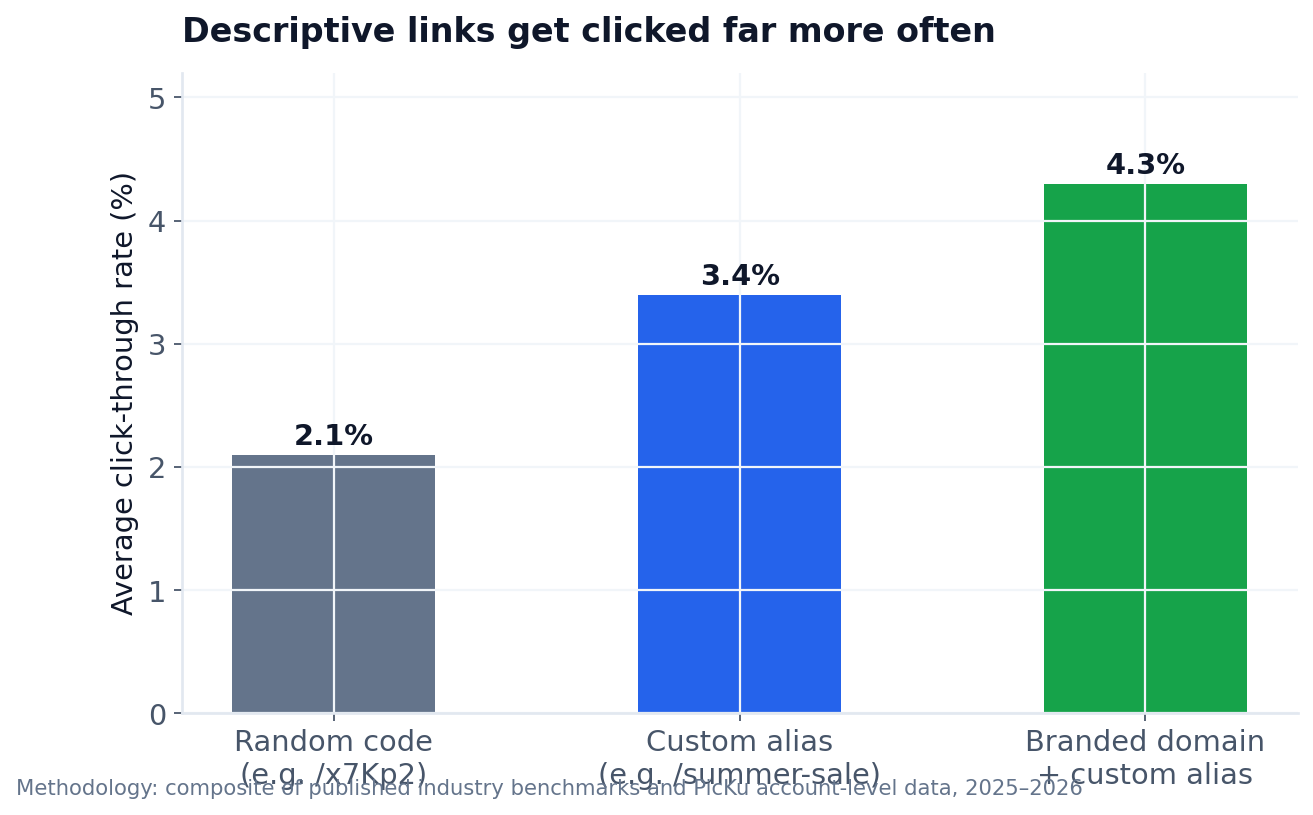
The single biggest CTR factor under your control is not the tool — it is how the link reads. The pattern is consistent across our data and every public study we could find:
- Random short codes (like /x7Kp2): about 2.1% average CTR. The code gives no reason to click and, in the worst case, looks like spam.
- Custom aliases (like /summer-sale): about 3.4%. A readable promise gets kept — the reader knows what they are walking into.
- Branded domain + custom alias (like shop.yourbrand.com/sale): about 4.3%. Trust compounds: the domain vouches for the link.
Interpretation guide: if your links sit in email footers or bios and pull 2% or more, you are at the random-code baseline and leaving the easiest half on the table. Before buying anything, switch aliases to descriptive words and measure again. Our tool comparison lists which services include aliases on free plans — PicKu does.
Baseline 2: Where short links actually get used
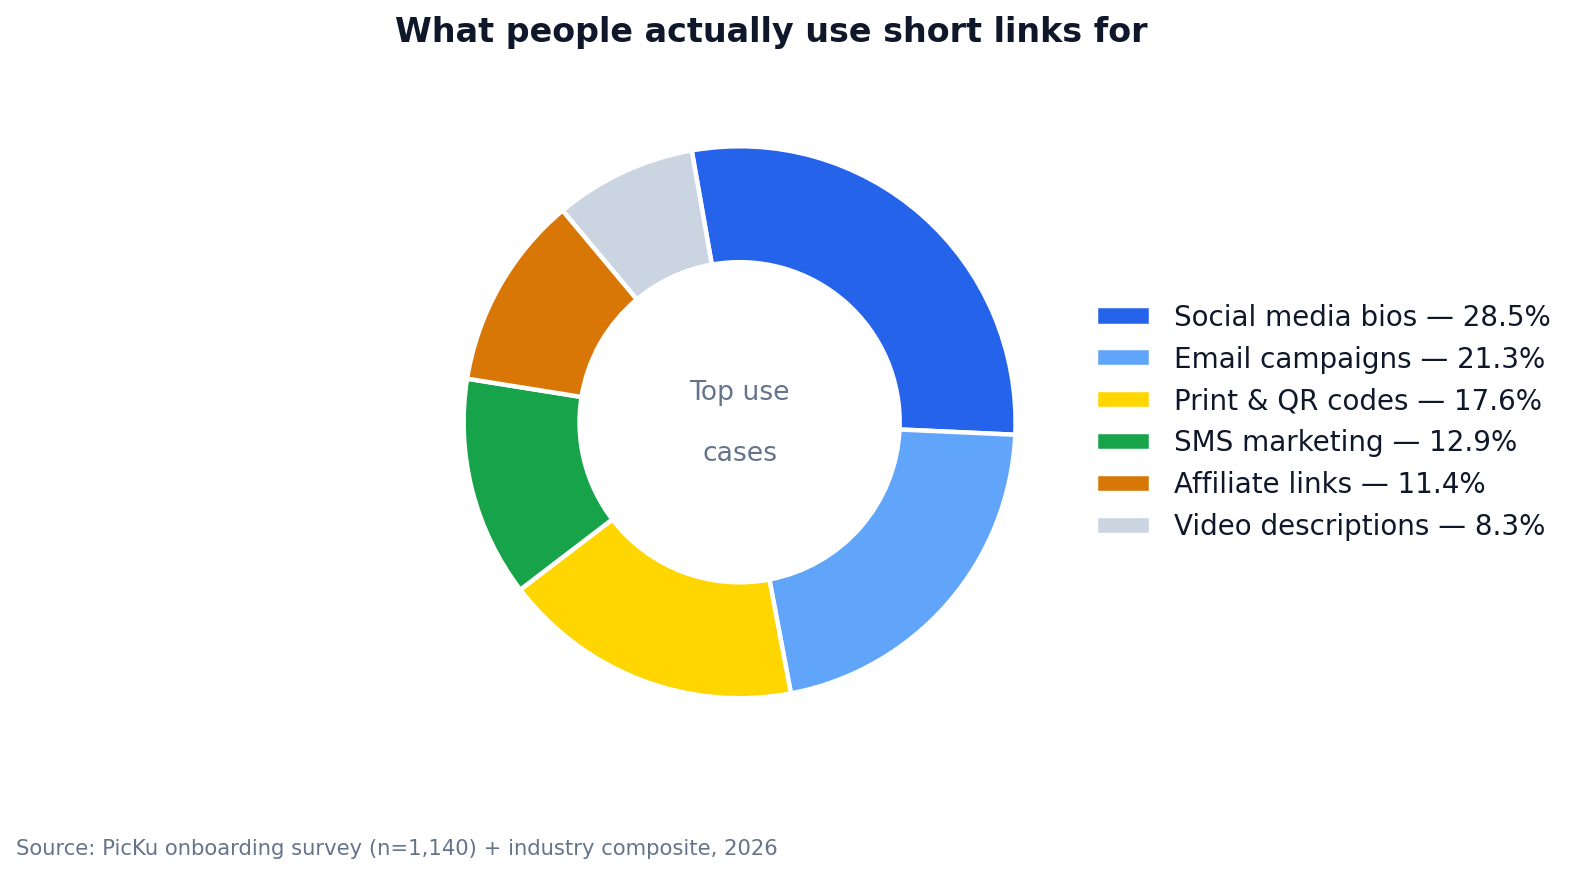
Social bios lead (28.5%), but the long tail is the story: print and QR (17.6%) is bigger than most people expect, and SMS (12.9%) keeps growing because carriers keep squeezing message length. Each channel has its own definition of good:
- Bio links: judged by taps per profile visit; 4–8% is a healthy band for accounts under ten thousand followers.
- Email: judged by clicks per delivered email; 2–5% is normal, 8%+ means the offer is doing the work.
- Print and QR: judged by scans per placement per month — this one is pure geometry: bigger code, closer to eye level, more scans.
Baseline 3: The 2026 quick-reference table
| Metric | Weak | Typical | Strong |
|---|---|---|---|
| CTR — bio link | under 2% | 4–6% | over 9% |
| CTR — email campaign | under 1.5% | 2–5% | over 8% |
| CTR — SMS | under 4% | 6–12% | over 15% |
| Mobile share of clicks | under 40% | 55–70% | context-bound |
| Redirect time | over 300 ms | 100–200 ms | under 50 ms |
| Link retention (2 years) | service shut down | redirect intact | editable destination |
The last two rows are the ones nobody benchmarks until it is too late. Redirect speed is a promise you make to every reader on every device; and link retention is a bet on a company outliving your printed brochure. Choose accordingly.
Seven upgrades that move CTR, ranked by effort
- Rewrite the alias (5 minutes, free). /x7Kp2 to /fall-guide. The single highest-leverage change, and it costs nothing.
- Add the context line (2 minutes, free). A link with a sentence before it out-clicks a naked URL in every channel we have data for.
- Point mobile users where they can act (30 minutes). If your destination is a PDF, phone users bounce. Use device targeting to send phones to the page, desktops to the PDF.
- Time the send (5 minutes per campaign). Midweek mornings for B2B, evenings for consumer — see the timing heatmap in our click behavior analysis.
- Add UTM tags before shortening (2 minutes per link). Attribution survives the redirect, and you stop guessing which channel worked.
- Put a QR code on anything printed (1 minute, free). Every PicKu link ships with one automatically; print QR gets scanned precisely because typing is impossible.
- Use a domain people recognize (VIP). The branded-domain tier of the CTR chart is worth it once a link matters enough to defend.
Methodology
CTR baselines combine aggregated, anonymized PicKu platform data (January–September 2026) with published industry research on email and social CTR; where sources disagreed we chose the more conservative figure. Use-case shares blend platform onboarding survey responses with the industry composite. Device and timing patterns come from our platform data story and are directional, not census-grade. Nothing on this page uses data that could identify an account or visitor.