
Posting a link and hoping for the best is not a strategy. The difference between guessing and knowing what your audience actually does usually comes down to one thing: click analytics. In this guide, we break down which click metrics matter, how to read them without fooling yourself, and how to set up measurable links in minutes — no data science degree required.
Why Click Analytics Matters More Than You Think
Every shared link is a tiny experiment. You chose a destination, a placement, and a message; the click count is the experiment's result. Without it, you cannot answer basic questions that directly affect your results:
- Which platform actually sends you visitors — the newsletter, the video description, or the bio link?
- Did anyone click the link in last week's campaign at all?
- Is that printed flyer generating any traffic, or was the print run wasted?
With click data attached to every link, these questions become arithmetic instead of speculation.
The Metrics That Actually Matter
Total Clicks
The headline number. Useful for volume, useless on its own — 1,000 clicks from a spammy source can be worth less than 50 from your best customers. Treat total clicks as a starting point, never a conclusion.
Clicks Over Time
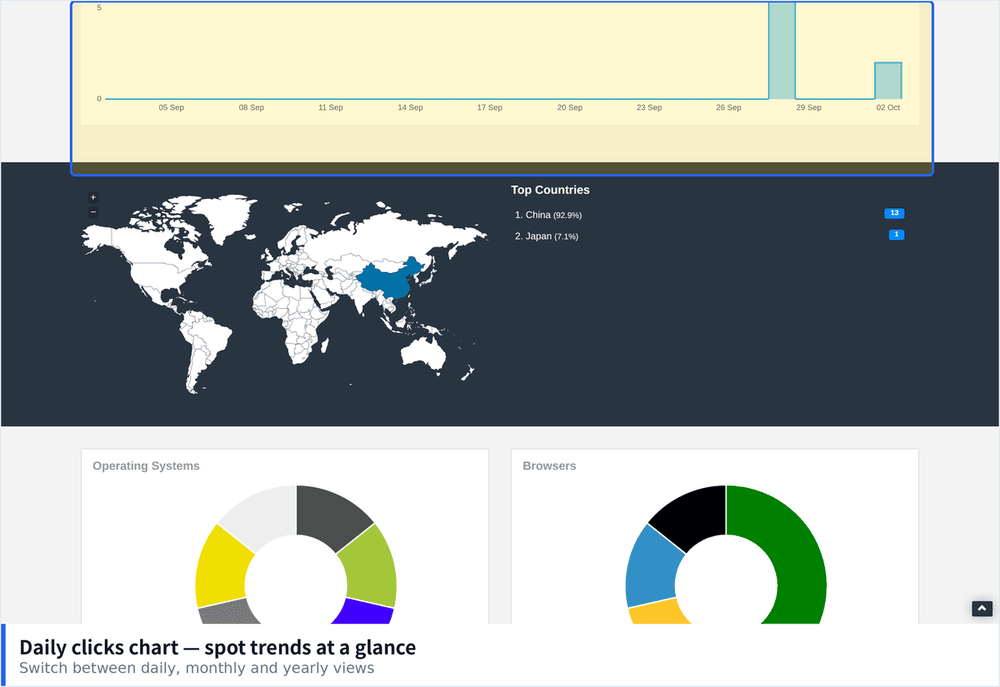
The shape of the curve tells a story that the total cannot. A sharp spike followed by a flat line suggests a one-time push (an email blast, a social post). A slow, steady trickle suggests search traffic or an evergreen placement. Campaign timing decisions — when to repost, when to retire an offer — should come from the curve, not the total.
Clicks by Source or Channel
If you create a separate short link for each channel (a technique called link differentiation), you get a clean per-channel comparison. This is the single most valuable habit in link analytics: same destination, different short link per placement, then compare.
Unique vs. Repeat Clicks
Some platforms count every click; others try to separate unique visitors. A small ratio of unique-to-total clicks is normal (people double-click, reload, or revisit), but an extreme imbalance can hint at bot traffic or accidental clicks.
Referrer and Device Data
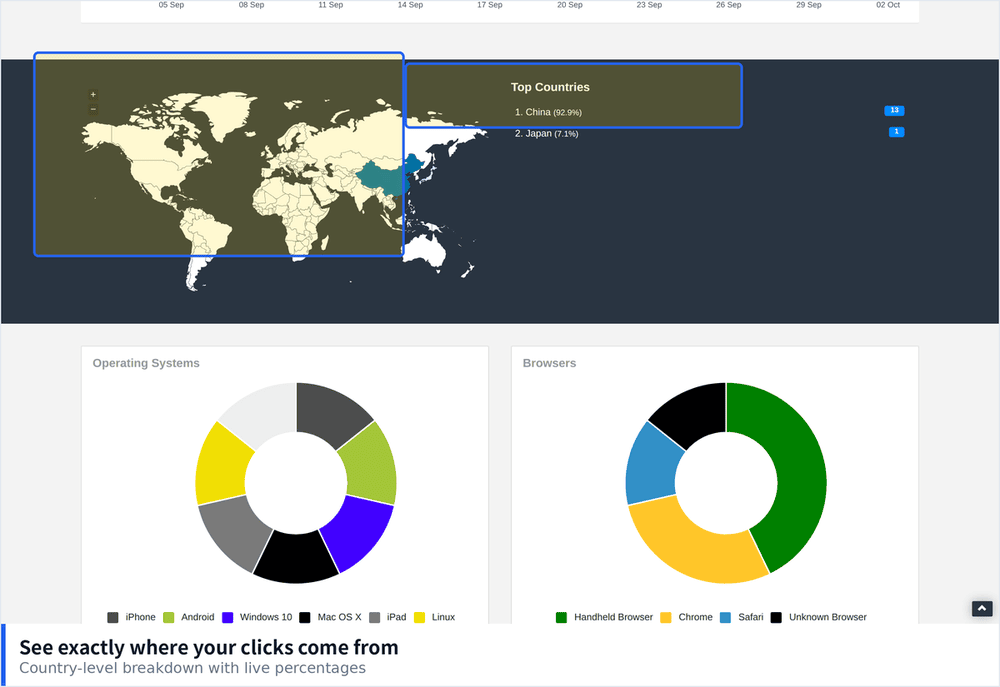
Where available, referrer and device breakdowns help you understand context: mobile-heavy traffic should land on mobile-friendly pages, and unexpected referrers can reveal that someone reshared your link somewhere you didn't know about.
How to Set Up a Trackable Link in Minutes
Step 1: Decide What Question You're Asking
"Which channel drives more clicks?" is a good question. "How many clicks?" is a weak one. Your question determines how many links you need.
Step 2: Add UTM Parameters (If You Use Google Analytics)
UTM parameters tag traffic for your analytics platform: source, medium, and campaign name. Build the final URL first, UTM included. If you need a refresher, our UTM parameters guide walks through each field.
Step 3: Shorten the Final URL
Paste the tagged URL into PicKu and give it a readable custom alias — for example /spring-newsletter. The short link preserves every parameter through the redirect.
Step 4: One Link per Channel
Newsletter gets /spring-email, the video description gets /spring-video, the bio gets /spring-bio. All point to the same page, but each one counts separately.
Step 5: Check the Data on a Schedule
Look at click stats 48–72 hours after publishing, then weekly for evergreen links. Fixed review times prevent both anxious refresh-refresh-refresh behavior and the opposite failure of never looking at all.
Reading Click Data Without Fooling Yourself
Beware of Small Samples
A link with 12 clicks tells you almost nothing. Channel comparisons need enough volume to mean anything; if one channel has 9 clicks and another has 11, you have learned nothing. Wait for volume before drawing conclusions.
Watch for Bot and Preview Traffic
Social platforms, chat apps, and crawlers often prefetch links to generate previews, inflating counts. A sudden burst of clicks from a data-center source with near-zero engagement downstream is usually a crawler, not a person. This is why click data should be read alongside downstream behavior (pageviews, conversions) when possible.
Compare Apples to Apples
A link in your email signature has been there for months; a promo link ran for three days. Comparing their totals directly is meaningless. Compare within matching time windows, or normalize by days active.
Clicks Are Not Conversions
Clicks measure interest, not outcomes. A channel that sends many clickers who never buy may be less valuable than a small channel whose clickers convert. Once volume justifies it, feed your UTM-tagged links into your analytics platform and compare conversion rates by source.
Practical Reporting: A Simple Weekly Ritual
- Pick your top 5 active links and record their totals in a spreadsheet. One row per week.
- Note one action per link: keep, iterate, or retire. Every link should have a verdict each week.
- Test one change: a different alias, a different placement, a different message. Change one thing at a time so the click delta is attributable.
Fifteen minutes a week is enough. The goal is not a dashboard you stare at; it is a habit of letting data settle your arguments about what works.
Frequently Asked Questions
Do I need an account to see click stats?
Basic shortening works without an account, but creating an account on PicKu lets you manage links and review their click statistics from your dashboard.
Will the redirect slow my site down?
The redirect happens before the visitor reaches your page and typically takes milliseconds. It does not add load to your website.
Can I see who clicked my link?
You see aggregate patterns — counts, timing, and where available referrer and device information — not personal identities. Click analytics is about behavior patterns, not surveillance.
How is this different from Google Analytics?
They complement each other. Click analytics works everywhere — even for destinations you don't control, like external affiliate pages — while Google Analytics provides deep on-site behavior. Short links carry your UTM tags into GA, connecting the two views.
Wrap-Up
Click analytics turns link sharing from a shot in the dark into a feedback loop. Start small: create channel-specific short links for your next campaign, check the numbers after three days, and let one real comparison — not a hunch — decide where you invest your next hour of promotion. PicKu gives every link built-in click stats and a QR code, so your first experiment can start right now.